Vivienne Prince

Thanks for dropping by my page!
I'm currently a Masters of Data Science student graduating in 2022.
I really enjoy learning new tools, exploring data to help solve problems, and helping others understand ideas and data.
Video Game Sales Data Analysis
December 2020 – with Amanda Norton and Ben Weisman

Overview:
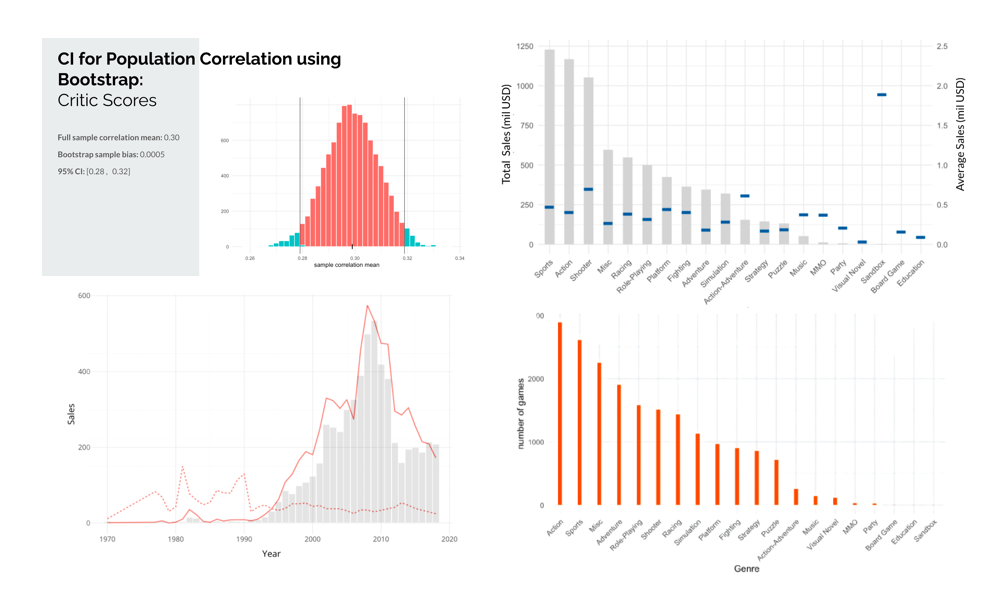
As video game fans, we decided to take a look at the relationship between video game sales and various variables such as critic/ user ratings, game genre, target audience, and the like.
We also were intrested in the distribution of these variables in our video game dataset pulled from VGChartz (video game data tracking website).
Tools:
Tidyverse: data cleaning/ reshaping
ggplot/ plotly: viz
Language used: R/ Markdown
To check out our full findings, take a look at our presentation (pdf).
Data cleaning/ viz code link (github).
These are some visualizations I created for our presentation:

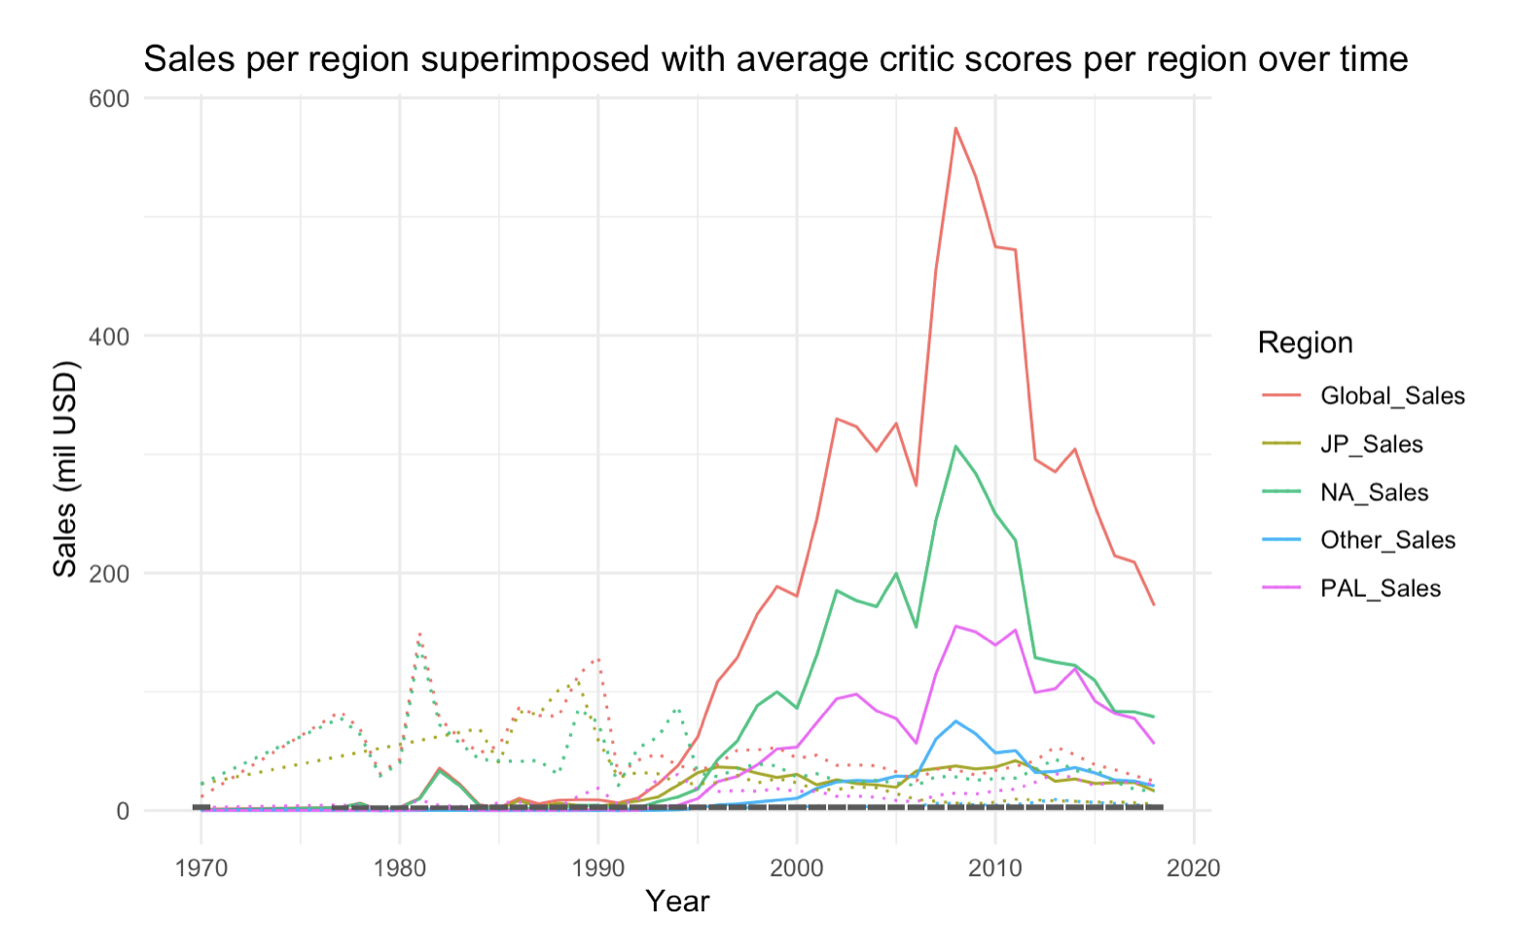
Here’s a test plot I did during EDA and my code:

My code:
vs_sales.byregion.byyear <- vs_byregion %>%
  group_by(Year, Region)  %>%
  summarize(SSales = sum(Sales))
vs_sales.byregion.byyear$MSales <- vs_byregion %>%
  group_by(Year, Region)  %>%
  summarize(means = mean(Sales)) %>%
  pull(means)

summary.data <- videogames.clean %>%
  group_by(Year) %>%
  summarise(SSales = sum(Global_Sales),
            MSales = mean(Global_Sales),
            Critic = mean(Critic_Score))


ggplotly(
vs_sales.byregion.byyear %>% ggplot(aes(x=Year))+
  theme_minimal() +
  ggtitle("Sales per region superimposed with average critic scores per region over time") +
  ylab("Sales (mil USD)") +
  geom_line(aes(y= SSales, color = Region))+
  geom_line(linetype = "dotted", aes(y= MSales*100, color = Region))+
  geom_bar()
)